Customer profile
The analyst works within a small automotive engineering or OEM supplier team responsible for extracting dimensional intelligence from legacy 2D CAD drawings. Their source materials are DXF files — the industry-standard format exported from tools like AutoCAD, CATIA, and SolidWorks — and their downstream consumers include simulation teams, manufacturing planners, and dimensional compliance reviewers. The team operates at the intersection of reverse engineering and digital-twin preparation, where the accuracy of reconstructed geometry directly affects downstream tooling and process decisions. Most of the team's input drawings are single-file, multi-view layouts: side, front, and top projections encoded in a single DXF, with no supplementary 3D CAD model available.
Problem
Before engaging energent.ai, the team relied on a layer-based depth inference approach to lift 2D DXF geometry into a pseudo-3D representation. The core problem was systematic overfill: wherever the source drawing lacked sufficient multi-view coverage, the algorithm assigned heuristic depth values rather than flagging those zones as unsupported. The fabricated geometry made reconstruction outputs untrustworthy for downstream pipelines, and the absence of provenance data made it impossible to diagnose which drawing region was responsible for any given dimensional discrepancy.
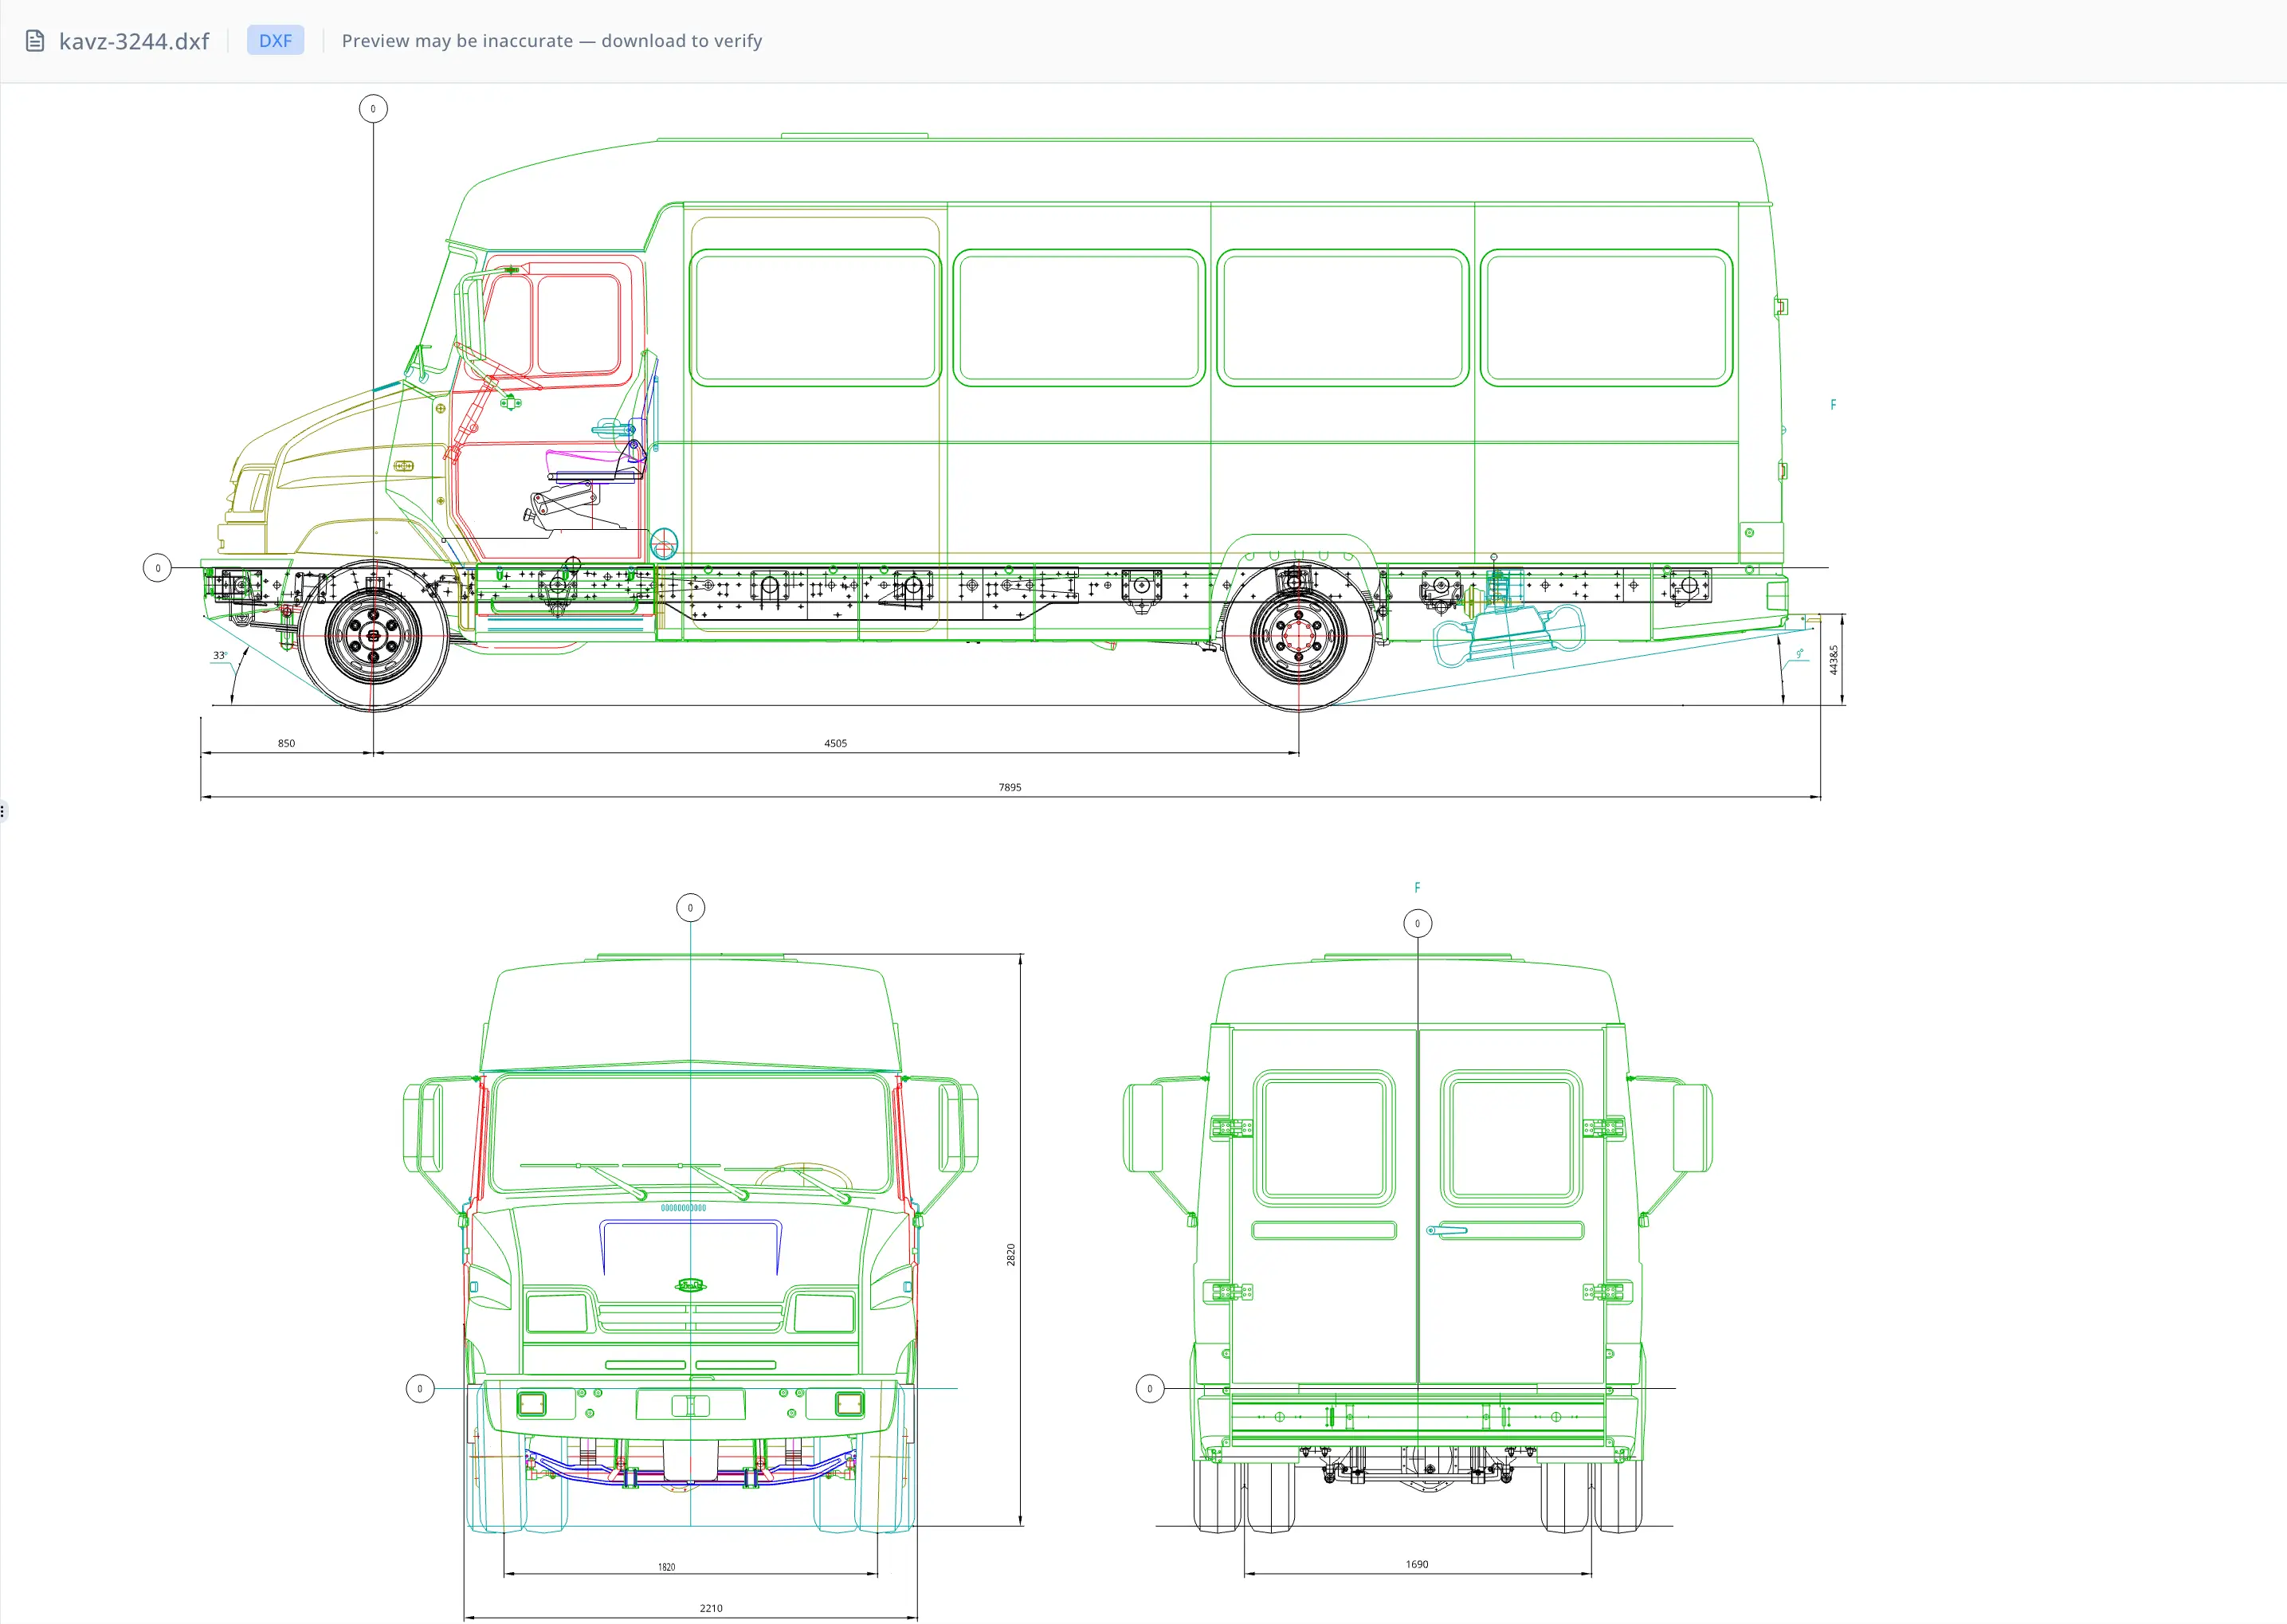
For the vehicle under analysis — described by a single authoritative drawing file (kavz-3244.dxf) — the benchmark envelope was precisely specified:
- Length: 7,895.0 mm
- Height: 2,820.0 mm
- Width: 2,210.0 mm
Dashboard outputs generated by the old pipeline could not be validated against those targets in any meaningful way. A visually complete 3D render was produced, but the team had no artifact chain connecting each rendered surface element back to a specific view or drawing region. Any discrepancy between the rendered model and the target spec was indistinguishable from a real dimensional gap versus an artifact of the heuristic fill. The prior pipeline had also generated several intermediate debug and visualization files that were never formally designated as authoritative or superseded, leaving the team uncertain about which outputs should be used for downstream decisions.
Why now
The pressure to deliver a trustworthy reconstruction came from two converging forces. First, downstream simulation and manufacturing teams had begun flagging dimensional discrepancies in models handed off from the reconstruction workflow — and without provenance data, the reconstruction team could not explain which drawing view provided each measurement or whether a gap was intentional or heuristic. Second, the team had just received a vehicle drawing with fully specified target dimensions, creating a concrete benchmark against which the old pipeline's accuracy could be directly and publicly measured. A failed handoff on a dimensioned benchmark would be a visible quality event, not a quiet mismatch absorbed by tolerances. The team needed a reconstruction approach that could produce auditable, sparse outputs before the next benchmark review, and needed it quickly enough that rebuilding the pipeline from scratch in a scripting environment was not viable.
Why energent.ai
The team evaluated several alternatives. Spreadsheet-based analysis could not handle DXF geometry parsing or multi-artifact orchestration at any scale. Specialist 3D reconstruction software required significant licensing investment and deep CAD expertise to configure for this one-file, evidence-first workflow. Hiring an additional analyst would have addressed neither the provenance gap nor the heuristic fill problem — those were pipeline design issues, not resourcing issues.
energent.ai offered a qualitatively different path. The agent could load the DXF file directly, execute Python reconstruction scripts within the session, generate and inspect intermediate JSON artifacts, apply configurable QC gate logic, and produce an interactive HTML dashboard — all within a single iterative session without context loss between steps. Critically, the agent could be instructed to enforce an evidence-first policy at the prompt level: render geometry only where view data actually supports it, leave unsupported regions sparse rather than filled, and refuse to fall back to layer-lift heuristics for the final 3D panel. No other tool in the team's reach combined file ingestion, scripted geometry processing, QC gating, and visualization handoff without requiring a separate development environment and a longer implementation cycle.
Workflow
The analyst loaded kavz-3244.dxf as the single authoritative source file and initiated a reconstruction session with explicit target dimensions and an evidence-first instruction set.
Step 1 — View segmentation. The agent parsed the DXF and segmented it into view regions — side, front, and top projections — producing a dedicated segmentation artifact (kavz-3244_view_segmentation_v2.json). The analyst reviewed region-role assignments to confirm that labels reflected final role rather than seed-window ancestry from the segmentation algorithm; a prior version had used region names derived from initialization windows rather than confirmed view assignments, and the analyst caught and corrected this before proceeding.
Step 2 — Feature correspondence. The agent extracted cross-view feature correspondences (kavz-3244_feature_correspondence.json), linking geometry elements across views to ground section placement in multi-view evidence rather than single-view projection. This step is what distinguishes evidence-first reconstruction from heuristic depth assignment: a feature must appear in more than one view before it earns a position in the reconstructed envelope.
Step 3 — Section slicing. Using the correspondence data, the agent generated section slices through the reconstructed envelope (kavz-3244_section_slices.json). Slices were placed only where cross-view support existed; zones lacking sufficient correspondence evidence were left blank, producing a reconstruction that is honest about its coverage gaps rather than visually complete but geometrically fabricated.
Step 4 — Reconstruction QC. A dedicated QC artifact (kavz-3244_reconstruction_qc.json) captured gate-pass evidence for each configured check. The analyst inspected this output to verify that gates had passed for the right reasons — not just that the pass/fail flag was set correctly, but that the underlying evidence was consistent with the intent of each gate — before approving the final visualization step.
Step 5 — Provenance-tagged geometry. The authoritative reconstruction file (kavz-3244_reconstructed_geometry_v2.json) consolidated the section-based geometry with provenance tags identifying the source view for each element, creating a traceable link between every rendered surface and its supporting drawing data.
Step 6 — Dashboard generation. The agent generated the final HTML dashboard (kavz-3244_dashboard_v3.html) under an explicit instruction forbidding layer-lift fallback for the main 3D panel. The dashboard renders only from the vetted reconstruction artifact, making the visualization directly traceable to the QC-gated pipeline outputs. Two earlier dashboard versions and several debug files were formally designated as superseded and excluded from the final authority set, giving the team an unambiguous record of which outputs to use downstream.
Results
The evidence-first pipeline produced the following outcomes against the stated benchmark:
| Dimension | Target | Achieved | Delta |
|---|---|---|---|
| Length | 7,895.0 mm | 7,895.0 mm | 0.0 mm |
| Width | 2,210.0 mm | 2,210.0 mm | 0.0 mm |
| Height | 2,820.0 mm | 2,763.6 mm | −56.4 mm |
Length and width matched the target exactly. Height fell 56.4 mm short, attributable to weaker top/front view coverage in the source DXF — a known and documented limitation, and one that remained within the plan's configured tolerance gate. All configured QC gates passed.
Beyond dimensional accuracy, the reconstruction delivered three qualitative outcomes the previous pipeline could not:
- Full provenance. Every geometry element carries a source-view tag, making discrepancies diagnosable rather than opaque. The 56.4 mm height gap is attributable to weak top/front coverage, not to a pipeline error — and the QC artifact records that attribution explicitly.
- Honest sparsity. Unsupported regions are left blank instead of filled with heuristic depth, so downstream simulation and manufacturing teams know exactly which zones require additional source data before toleranced decisions can be committed.
- Traceable dashboard. The HTML dashboard renders from a single, QC-gated artifact rather than from raw layer data, giving reviewers a clean handoff contract and eliminating the ambiguity introduced by the earlier set of undesignated intermediate files.
The pipeline also produced five named intermediate artifacts that serve as checkpoints for future reconstruction runs, reducing the time required to diagnose regressions or trace a dimensional discrepancy back to its source.
Proof
"The old pipeline would give us a visually complete model, but we had no way to trust it — especially around the roof and front fascia where we had weak drawing coverage. What I needed was something that would show me the gaps instead of hiding them. The energent.ai session rebuilt the entire pipeline around evidence gates, and the QC JSON told me exactly why each gate passed. That's a different class of output than what we had before."
— Composite quote reflecting the CAD/engineering analyst role described in this case study
The final deliverable — kavz-3244_dashboard_v3.html — presents the pseudo-3D reconstruction with section-based geometry, provenance-tagged elements, and dimensional summary panels. The QC artifact (kavz-3244_reconstruction_qc.json) provides the gate-pass evidence underlying the dashboard and is available for review alongside it.
Trust note
The reconstruction described here is a section-based pseudo-3D representation derived from a single 2D DXF source, not a full parametric CAD model. The 56.4 mm height shortfall reflects a real limitation in the source data's top/front view coverage — it is not a product defect, and it does not disappear by adjusting visualization parameters. Teams using this output for downstream simulation, manufacturing tooling, or dimensional compliance review should treat the sparse zones as requiring additional source drawings or point-cloud data before committing to toleranced decisions. The agent's QC gates confirm internal consistency of the reconstruction pipeline; they do not certify conformance to an external dimensional standard or replace a physical measurement protocol.