James Whitfield leads development underwriting at Meridian Retail Partners, a regional retail real estate firm with a pipeline spanning community centers, power center pads, and ground lease structures. His mandate covers the full capital stack: sizing construction debt, projecting stabilized NOI, and stress-testing macro assumptions before each deal reaches investment committee.
Four live macro levers, four disconnected spreadsheet tabs
Whitfield's 24-month pro forma depended on four interdependent macro inputs — the 10-Year Treasury yield, 30-Year mortgage rate, CPI, and nonresidential construction spending — each sourced separately, each with its own update cadence, and none linked to the pro forma model. Stress-testing a 150 bps Treasury spike against simultaneous hard-cost inflation meant manually relinking assumptions across disconnected tabs, with version drift and broken cell references endemic to the process. The stakes were material: a 50 bps expansion in terminal cap rates could break the DSCR covenant and eliminate the GP promote entirely. A flat 4% developer fee could be eclipsed by a 12-month timeline extension under capital markets dislocation. The existing model had no mechanism to sensitize either scenario.
Energent.ai consolidated all four levers into one analytical frame
The analyst uploaded four macroeconomic CSV files. The agent:
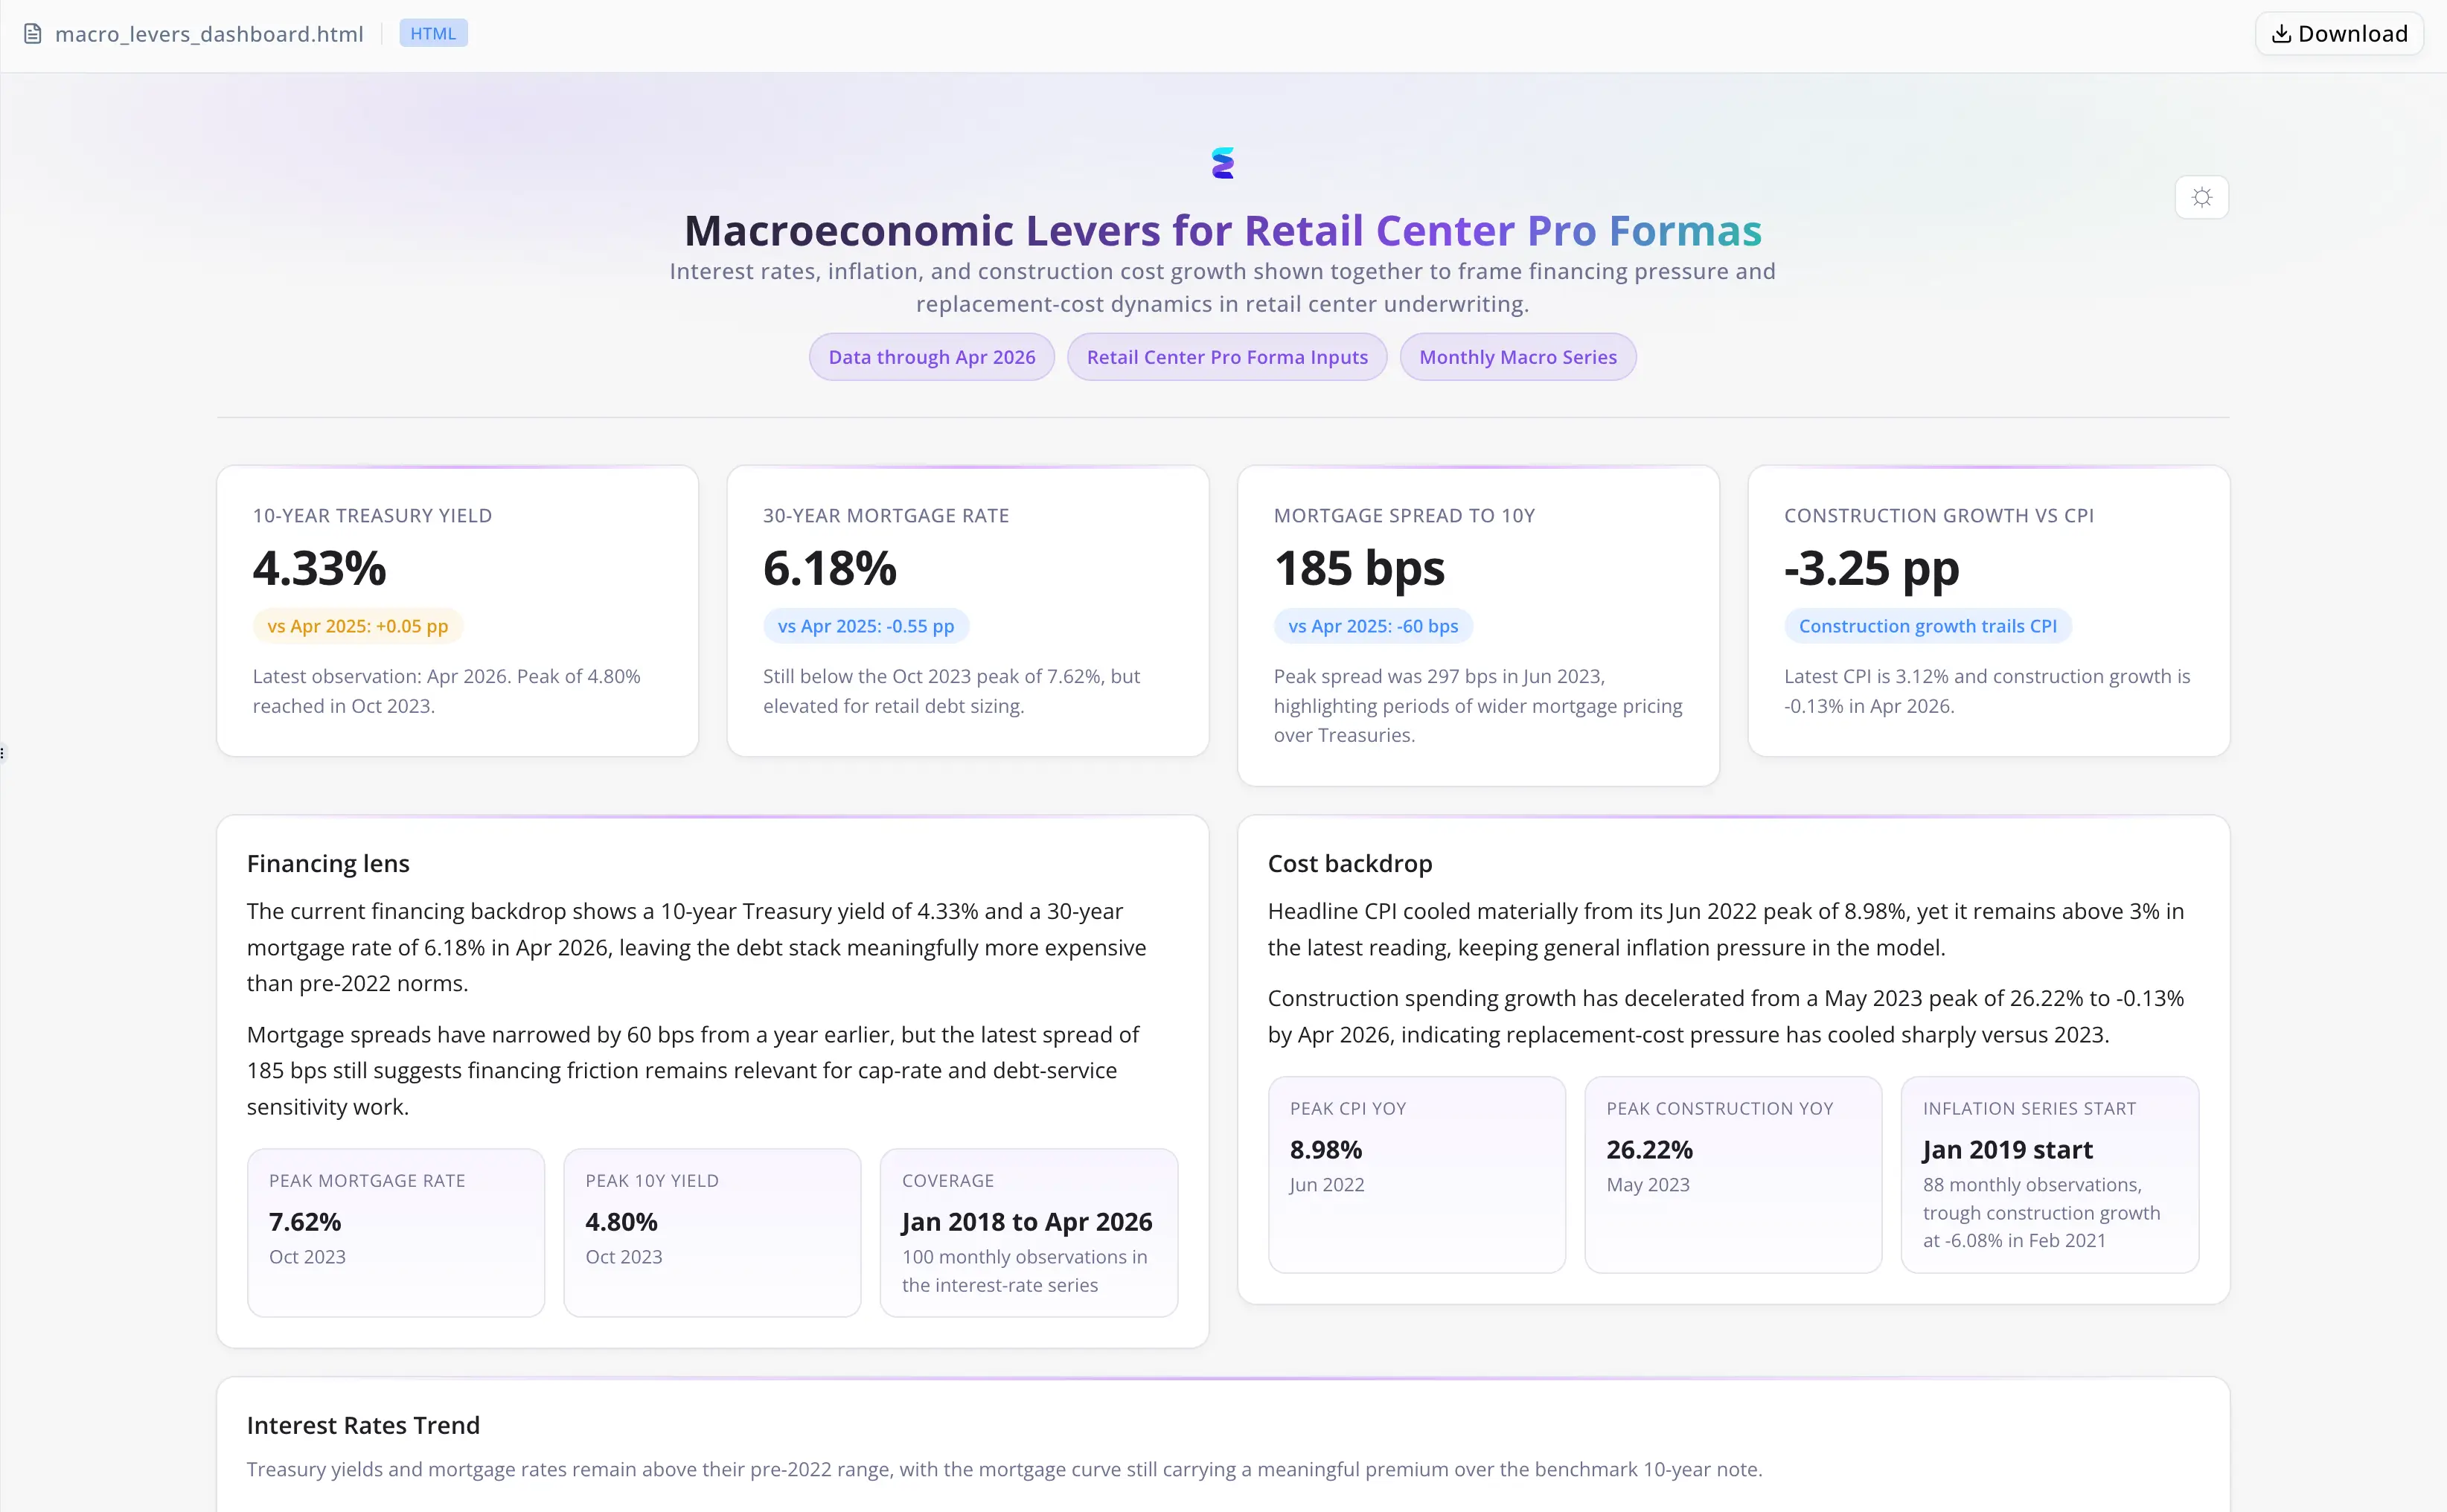
- Merged all four datasets and computed year-over-year growth rates for CPI and construction spending — the two series where rate of change, not level, drives pro forma inputs
- Generated a multi-panel macroeconomic dashboard covering interest rate trends, CPI trajectory, and construction cost growth on a consistent time axis
- Synthesized the Retail Center Macro Assumption Checklist — a four-section framework covering debt costs and Treasury dynamics, CPI and rent escalators, hard-cost inflation, and the compound effect on levered IRR and developer fee structures
- Delivered a four-question IC summary keyed to DSCR covenant survival, exit cap rate linkage, CPI cap accuracy, and front-loaded construction cost assumptions
No manual tab relinking. No dashboard pre-configuration. No junior analyst hand-off.
Interpretive output, not just consolidated data
- The merge produced analytical derivatives — YoY growth rates for CPI and construction spending gave Whitfield the inputs his model required, not just joined tables
- Four modeling traps were explicitly named — cap rate stickiness under a 150 bps Treasury move, the 3% lease cap wedge against 6% actual inflation, nonlinear construction cost behavior during supply chain shocks, and developer fee eclipsis under a 12-month timeline extension
- Output format matched the delivery requirement — the checklist was structured for direct attachment to the investment memorandum, without reformatting
How James Whitfield runs it day-to-day
- Upload four macro CSVs: 10-Year Treasury yield, 30-Year mortgage rate, CPI, nonresidential construction spending
- Agent merges all four datasets and computes YoY growth rates for CPI and construction spending
- Review the multi-panel dashboard for trend alignment across the full time series
- Take the Retail Center Macro Assumption Checklist directly into IC prep

Half-day of spreadsheet work completed in one session
- Four macro datasets consolidated into one analytical frame, YoY growth rates computed for the two most volatile series
- Multi-panel macroeconomic dashboard produced without a pre-built template or manual charting configuration
- Four specific modeling traps documented with named mechanisms: cap rate stickiness, the 3% CPI cap wedge, nonlinear construction costs, and developer fee eclipsis
- Investment committee checklist delivered in IC format, structured around DSCR covenants, promote sensitivity, and exit cap rate dynamics

"That's not a dashboard output. That's underwriting judgment in a structured format." — James Whitfield, Senior Development Analyst at Meridian Retail Partners