Merbridge Capital Partners is a mid-market private equity and M&A advisory firm specializing in leveraged acquisitions. Tom Haasen's work sits at the intersection of credit structuring and macroeconomic benchmarking — building cost-of-capital assumptions that survive LP scrutiny and lender term-sheet negotiation. The team runs lean: two to four analysts, several transactions per year, timelines that leave no slack for manual data engineering.
The benchmark dataset had gaps the three-tranche model could not price around
The MBI was structured on a 33% equity contribution, with the remaining 67% financed across three instruments: Senior secured debt at the base, Payment-in-Kind (PIK) notes in the mezzanine layer, and Vendor paper as the subordinated seller note. Each priced off a different benchmark — treasury yields, BAA corporate credit spreads, and bank lending rates respectively.
Stress-testing the model required regime-level statistics spanning four distinct macroeconomic environments: the pre-2008 credit expansion, post-GFC low-rate suppression, pandemic-era zero-rate floor, and the 2022–2023 tightening cycle. The historical benchmark dataset covered that full span — but it contained missing index values across certain years and series. Extracting mean rates and implied cost-of-capital ranges for each tranche was blocked until those gaps were resolved programmatically.
The deal was in late-stage due diligence, with lender distribution due within the week. Manual re-indexing across three multi-decade rate series was estimated at several hours — time the timeline could not absorb.
Energent.ai took the dataset from raw CSV to structured analysis in one session
Haasen uploaded the benchmark CSV. The agent handled everything downstream:
- Ingested the dataset and confirmed column headers and year range before proceeding
- Diagnosed missing index errors in the initial extraction script, modified the logic to handle available years gracefully, and re-executed — without analyst intervention in the debugging loop
- Extracted mean treasury yields, bank lending rates, and BAA corporate spreads by rate regime, with implied cost-of-capital ranges for Senior debt, PIK notes, and Vendor paper across each period
- Drafted a written analysis identifying the structural trap where PIK accrual compounds against a deteriorating debt-service coverage ratio as senior spreads widen — mapped to specific regime transitions
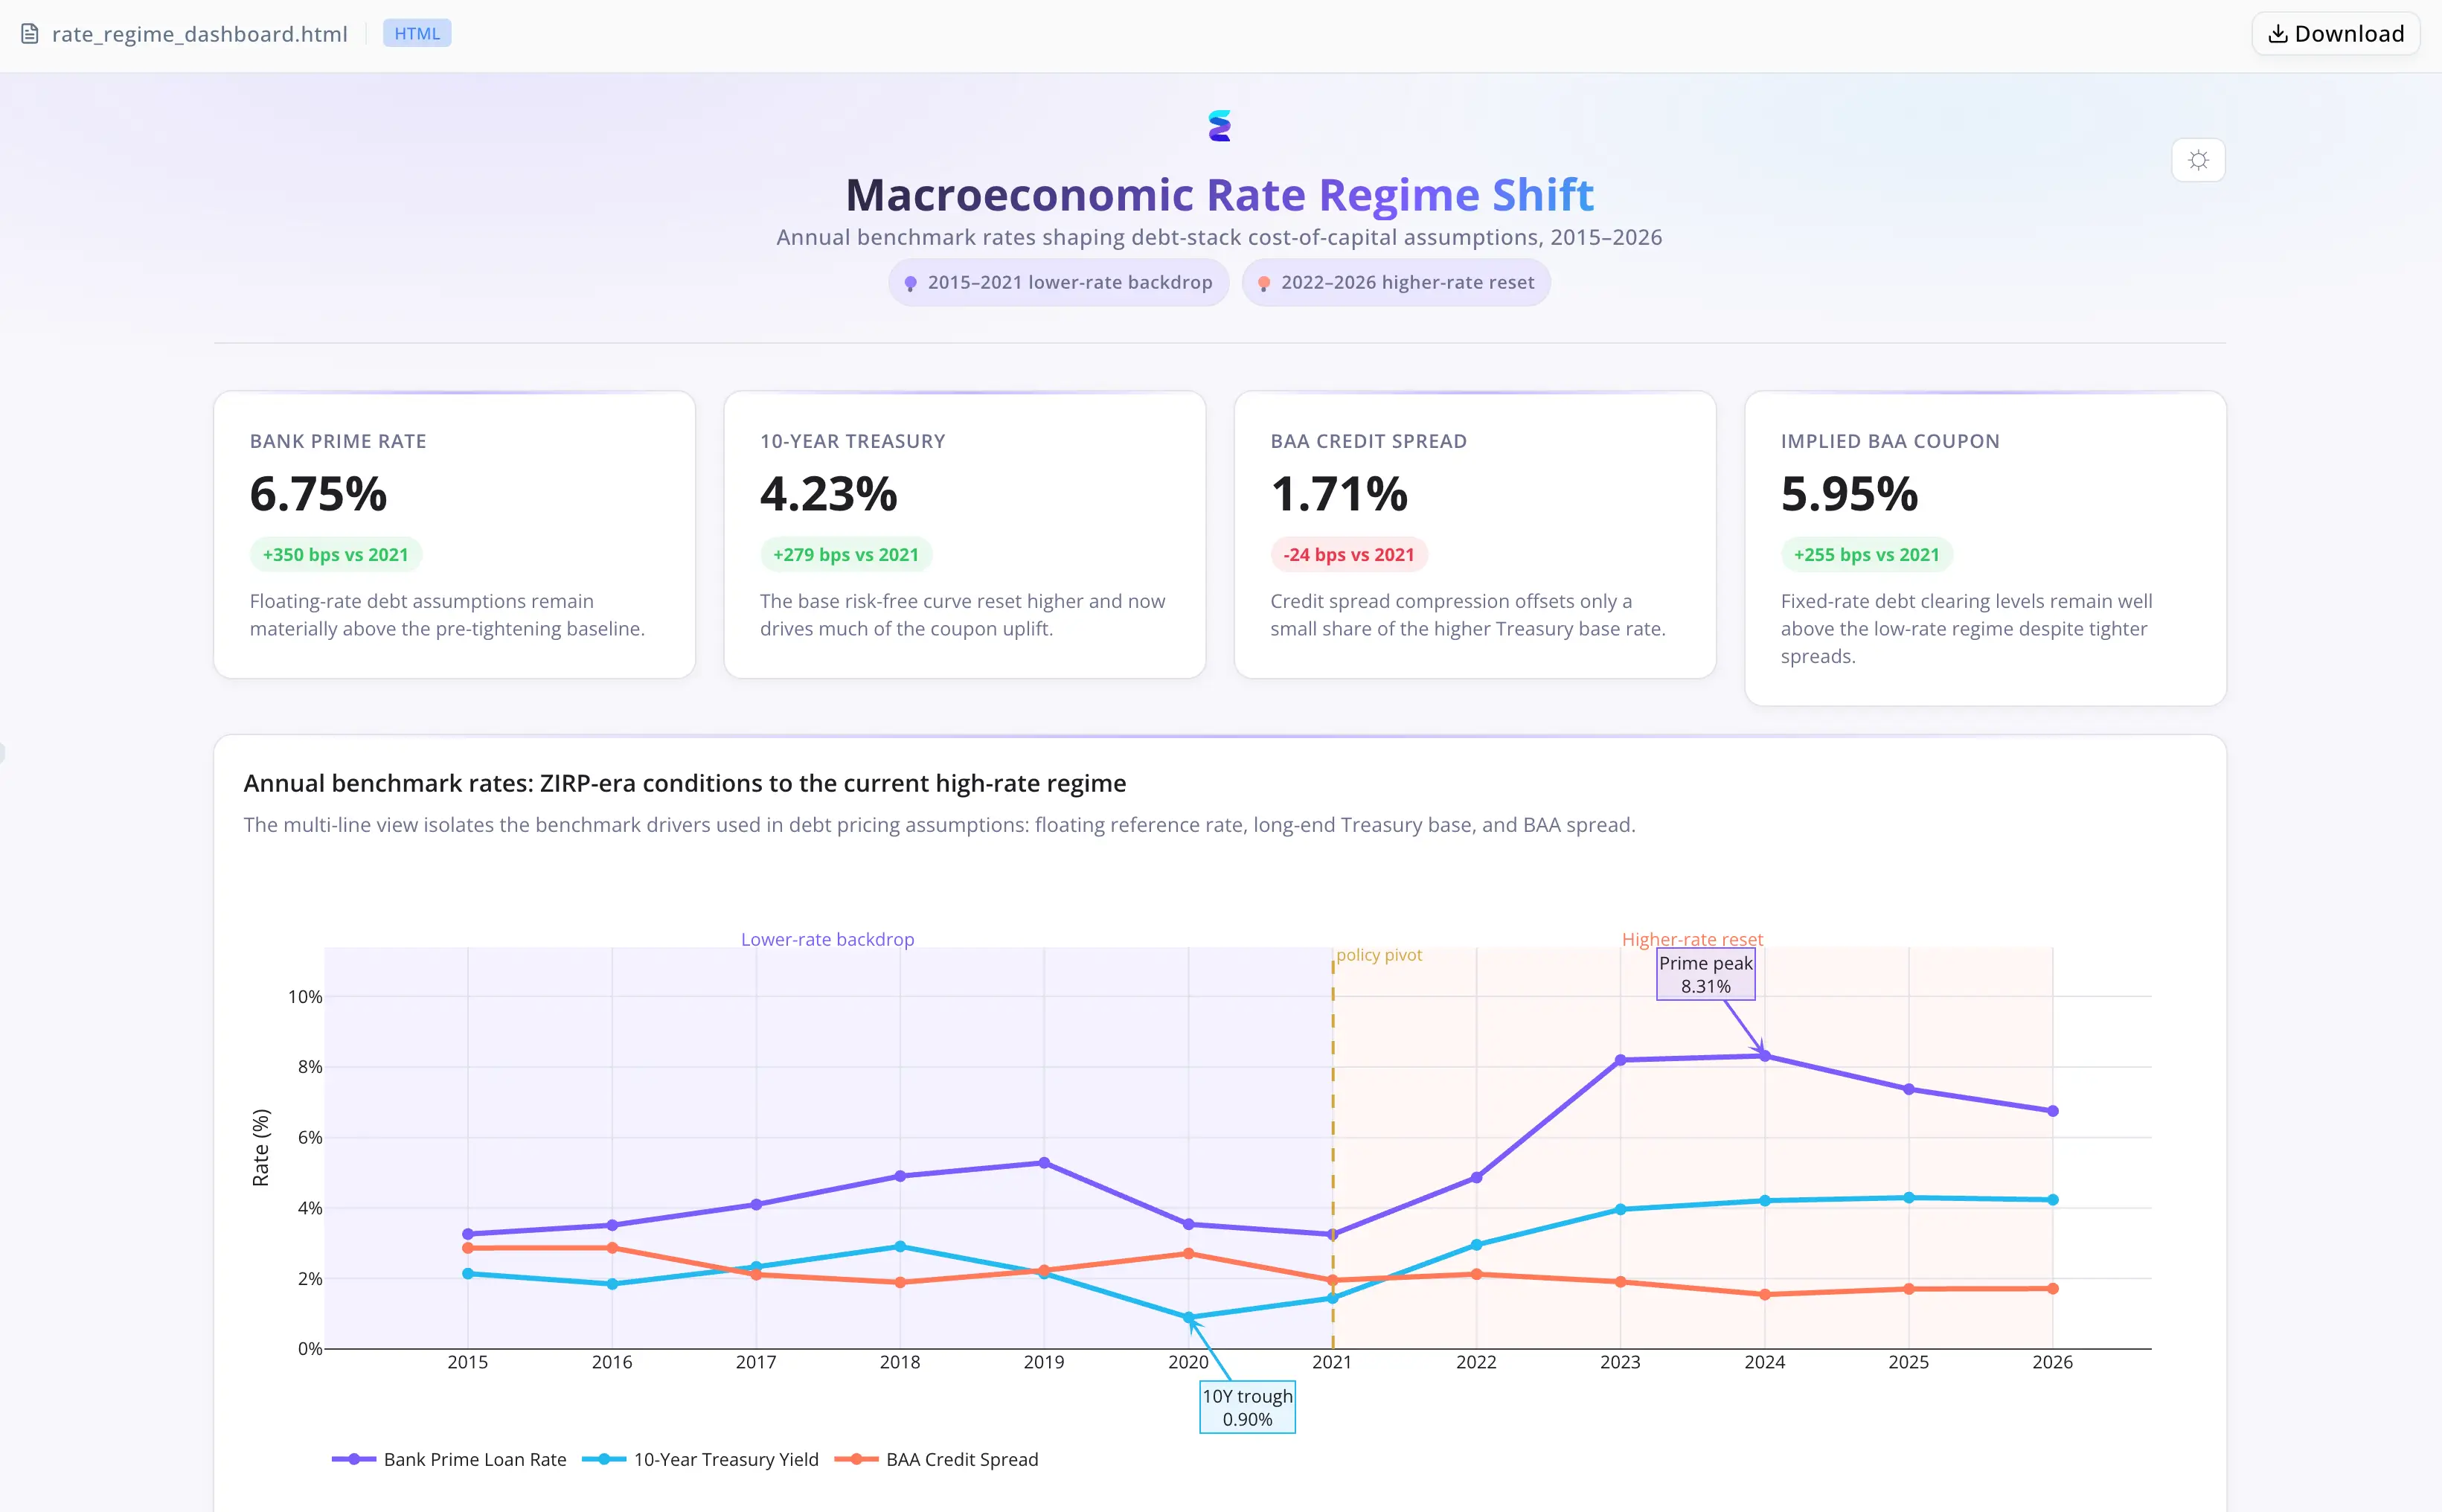
- Produced an interactive rate-regime dashboard overlaying all three benchmark series and MBI tranche cost ranges across the full historical dataset, annotated at each regime transition
No custom pipeline. No separate debugging session. No manual re-indexing pass.
In-context error handling closed the gap between raw data and finished analysis
- End-to-end session continuity: ingestion, gap resolution, extraction, written analysis, and visualization ran inside one uninterrupted session — no tool handoffs, no analyst-in-the-loop debugging breaks.
- In-context error resolution: missing index errors that would have halted a standard notebook workflow were diagnosed and fixed by the agent before the next execution, without requiring intervention.
- Computation and analysis produced together: the regime statistics table and written tranche analysis arrived as a finished block, ready to drop into the financing model and deal memo rather than raw numbers requiring separate interpretation.

Data wrangling that blocked half a day collapsed into one session
- Missing index errors across a multi-decade historical dataset resolved programmatically, without analyst involvement in the debugging cycle
- Regime-level statistics extracted for all three MBI tranches — mean rates and implied cost-of-capital ranges across four distinct macroeconomic environments
- Written analysis of PIK compounding and senior spread sensitivity incorporated into the deal memo
- Interactive rate-regime dashboard reviewed and cleared for distribution to the lender group
"Having an agent that could ingest the CSV, hit the missing-index errors, fix them, and hand me regime-level stats in one session changed the calculus on what's feasible under deal timelines. The dashboard was the piece I hadn't expected — walking lenders through historical spread regimes with a visual reference is a different conversation than a table in a deck." — Tom Haasen, Senior Analyst at Merbridge Capital Partners