Meridian Capital Advisors is a US-based investment research firm covering publicly traded healthcare distributors. James Whitfield builds forward projection models used for investment decisions, capital allocation reviews, and scenario planning. The team operates without a dedicated data engineering function — analysts source, clean, and model data end-to-end.
EDGAR's comparator structure was corrupting FY2022 actuals before modeling could begin
Building a credible 3-year forecast required clean actuals for eight line items — Revenue, COGS, SG&A, Interest Expense, Capital Expenditures, Accounts Receivable, Accounts Payable, and Inventory — across FY2022, FY2023, and FY2024, sourced directly from Cardinal Health's 10-K filings on SEC EDGAR.
Two failure modes blocked a reliable manual extraction. First, the US-GAAP taxonomy uses concept names that do not map intuitively to economic line items, and the same item can appear under different tags depending on each filer's disclosure practices — navigating that taxonomy for eight concepts has no shortcut.
Second, EDGAR's JSON structure surfaces prior-year comparator values alongside current-year figures. A naive extraction that groups by fiscal-year label pulls duplicate or mismatched values, corrupting actuals before any modeling begins. For Cardinal Health, this structural feature would have corrupted the FY2022 actuals entirely. Beyond extraction integrity, Inventory showed significant fluctuation across the three-year lookback — applying a simple historical average ratio to the projection layer would produce unreliable estimates with no visible warning.
Energent.ai became the extraction engine and workbook builder in a single session
The agent loaded the Cardinal Health EDGAR JSON facts file and handled the full stack:
- Mapped the US-GAAP taxonomy to identify the correct concept tag for each of the eight target line items
- Extracted FY2022, FY2023, and FY2024 actuals by grouping on period end date — not filing-year label — eliminating comparator duplicates at the source
- Built
CAH_3Yr_Forecast.xlsxwith formula-driven projection layers wired to a single editable growth assumption cell (B2, set at 3%) - Flagged Inventory with a programmatic "Unstable Ratio" marker where historical ratio fluctuation made a simple moving average unreliable
- Produced
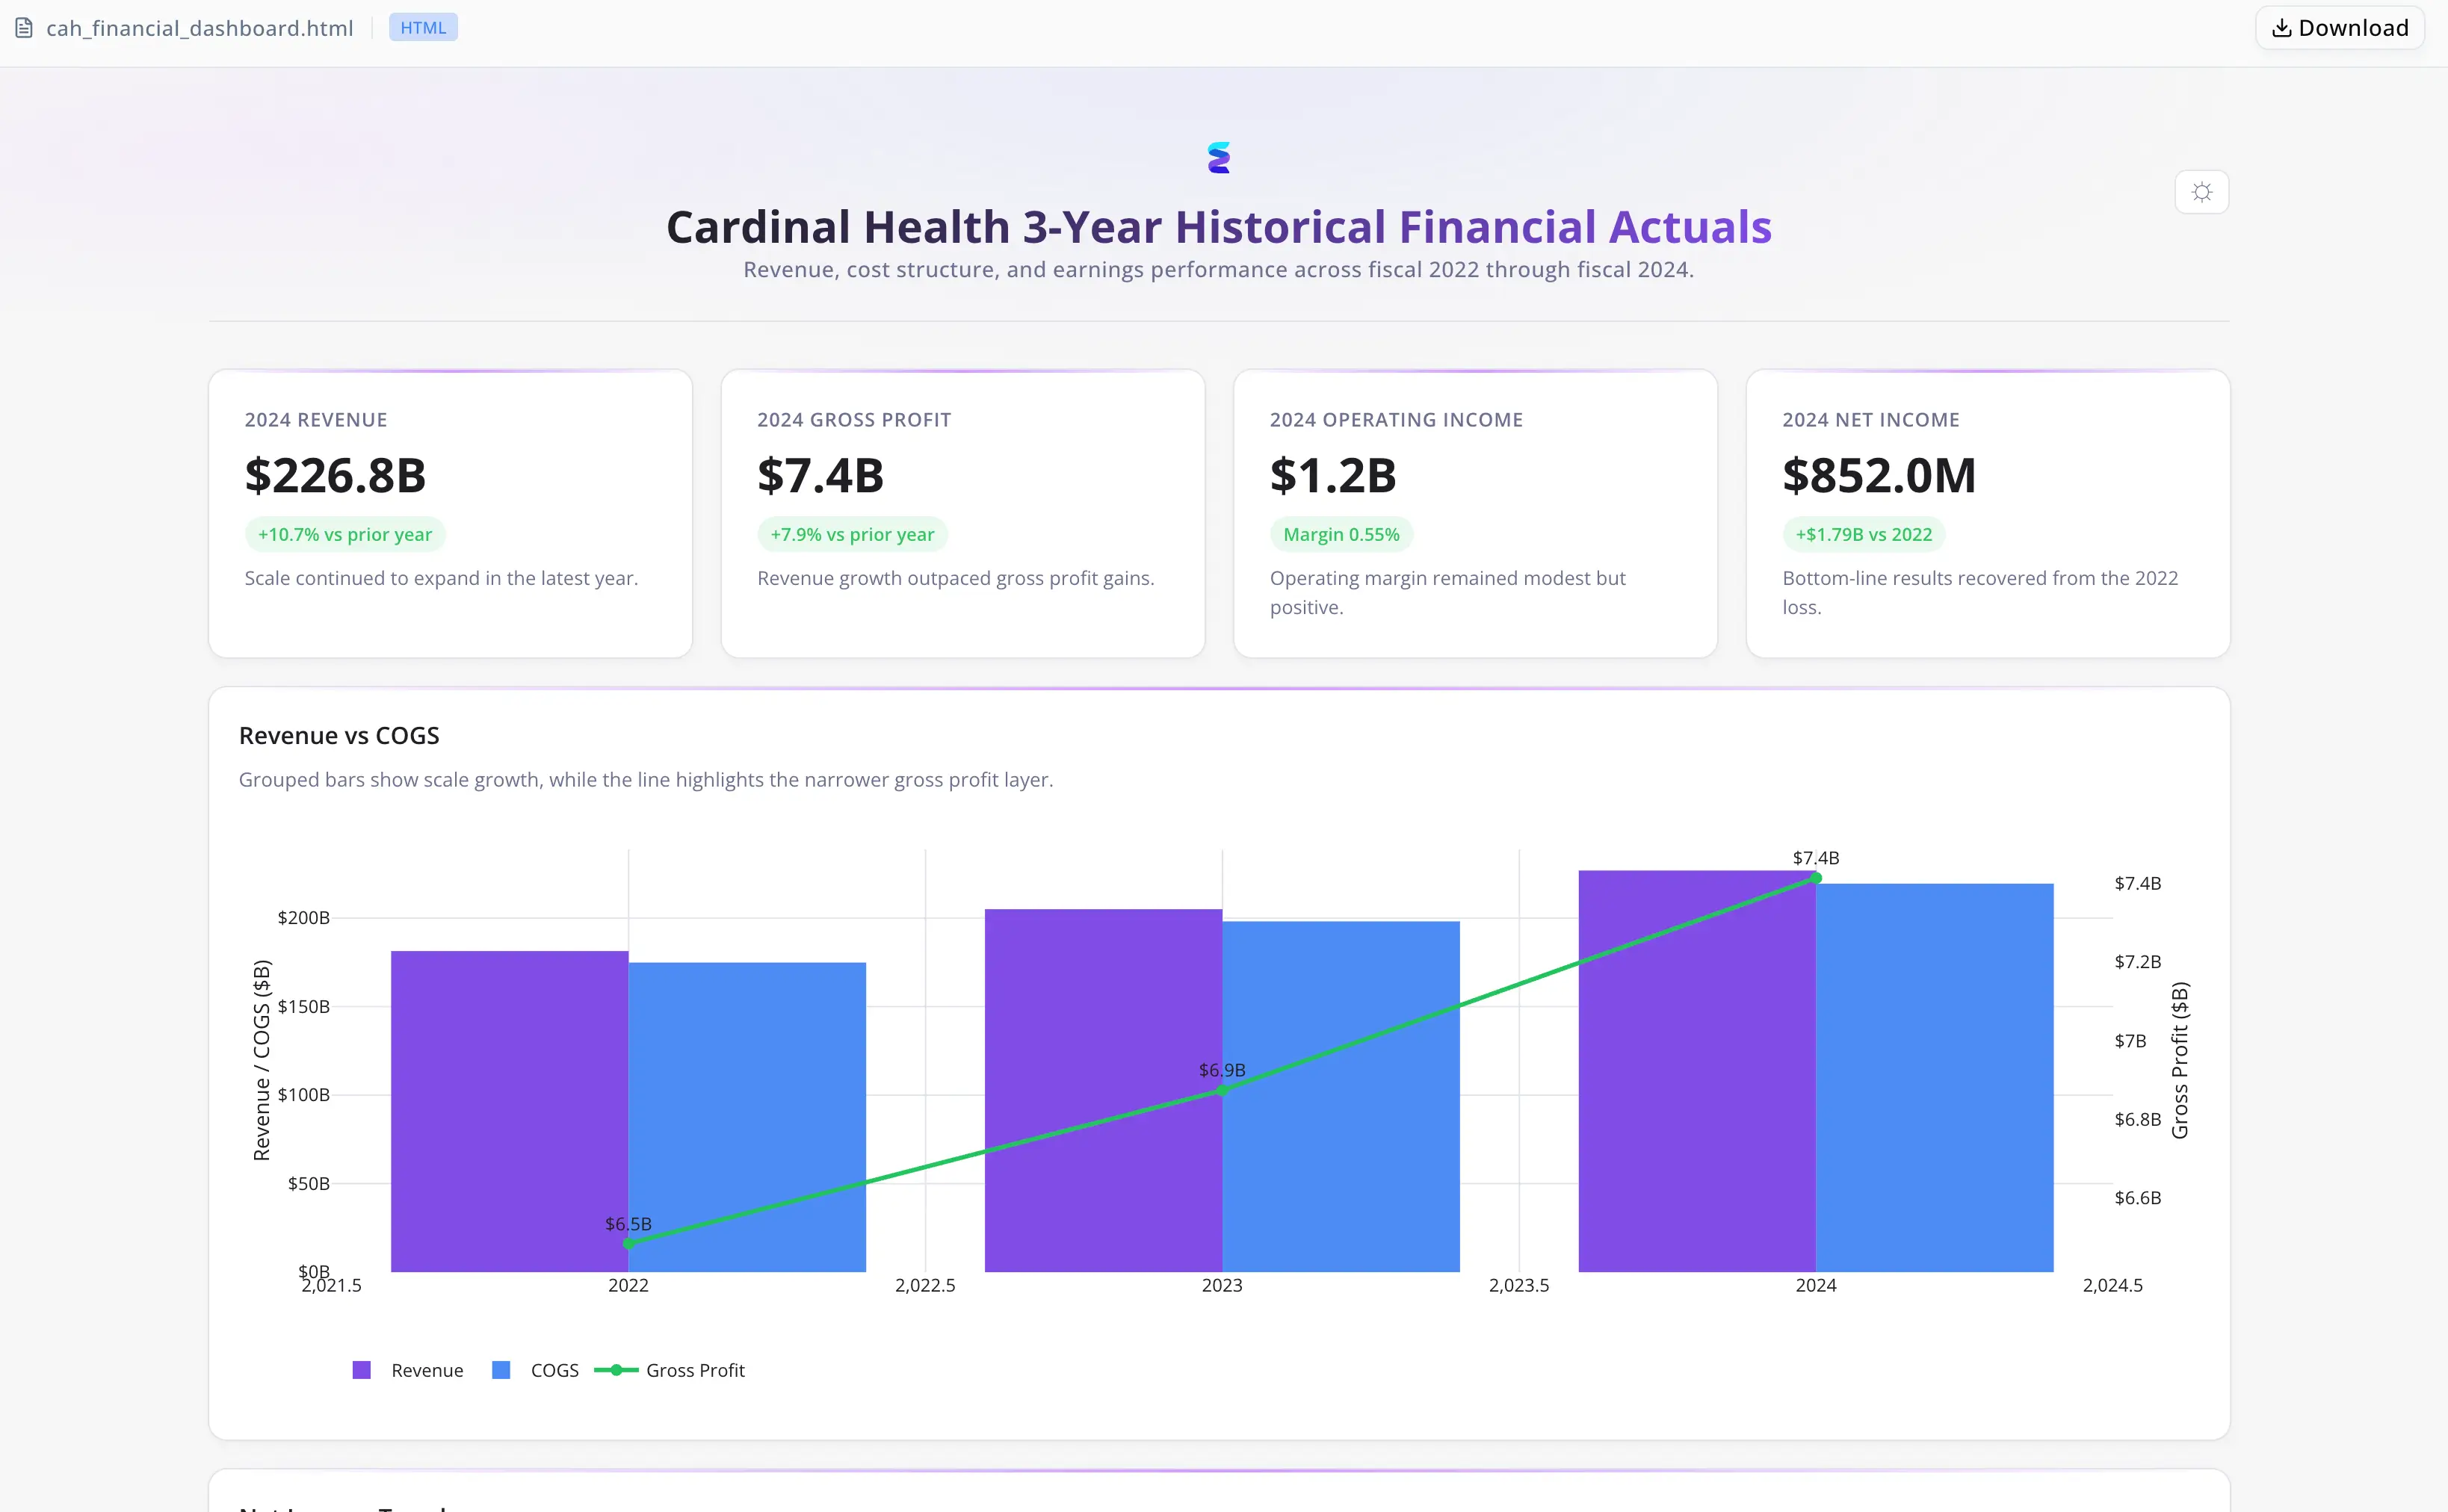
cah_financial_dashboard.html— an interactive visualization of Revenue, COGS, and Net Income across the three historical years
No manual comparator reconciliation. No taxonomy lookup by hand. No model rebuild when the next 10-K is filed.
Period-date grouping, not filing labels, is what made the actuals trustworthy
- Taxonomy resolution at ingestion: The agent mapped the full US-GAAP concept taxonomy before extracting any values, ensuring the correct tag was matched to each economic line item regardless of each filer's disclosure conventions.
- Comparator filtering by design: Grouping by period end date rather than filing-year label isolated clean 12-month trailing figures for each of FY2022, FY2023, and FY2024 — eliminating the structural duplication that corrupts standard EDGAR extractions.
- Programmatic Unstable Ratio flags: Where historical ratios fluctuated too widely across the lookback period, the workbook surfaced an explicit flag rather than silently applying a flawed average to the projection layer.
- Single-cell scenario architecture: All cost-structure formulas chain back to one editable growth assumption cell — stress-testing is a matter of changing a single value, not editing model structure.

Eight line items, three fiscal years, one session
- Verified actuals for all eight US-GAAP line items across FY2022, FY2023, and FY2024 — sourced directly from SEC EDGAR and traceable to source
- Prior-year comparator labeling errors identified and corrected before the workbook was constructed
CAH_3Yr_Forecast.xlsxdelivered with formula-driven projection layers and Unstable Ratio flags on volatile working capital linescah_financial_dashboard.htmlproduced alongside, ready for internal review presentations

"The Unstable Ratio flag on Inventory is exactly the kind of guardrail that prevents a formula from silently producing a nonsense projection in year three." — James Whitfield, FP&A Analyst at Meridian Capital Advisors