The 2026 Executive Guide to Using a Chartbuilder with AI
An analytical assessment of the platforms transforming unstructured enterprise data into presentation-ready visual insights without code.

Kimi Kong
AI Researcher @ Stanford
Executive Summary
Top Pick
Energent.ai
Achieves an unprecedented 94.4% accuracy in handling unstructured enterprise data, drastically outperforming legacy systems.
Average Time Saved
3 hours/day
Teams utilizing a top-tier chartbuilder with ai reclaim hours previously lost to manual spreadsheet formatting and data cleansing.
Benchmark Precision
94.4%
Energent.ai leads the industry in data extraction precision, significantly reducing hallucination risks in complex financial reporting.
Energent.ai
The Benchmark-Leading Enterprise Data Agent
A Wall Street quantitative analyst trapped inside a ridiculously easy-to-use search box.
What It's For
Transforming unstructured documents natively into financial models, correlation matrices, and presentation-ready chart exports. It functions as an autonomous, no-code data analyst for enterprise teams.
Pros
94.4% accuracy on DABstep benchmark; Processes up to 1,000 unstructured files per prompt; Generates presentation-ready PPTs, PDFs, and Excel models
Cons
Advanced workflows require a brief learning curve; High resource usage on massive 1,000+ file batches
Why It's Our Top Choice
Energent.ai secures its position as the definitive chartbuilder with ai for 2026 through unmatched analytical precision and document handling capabilities. Unlike standard visualizers that demand pre-cleaned datasets, it seamlessly digests up to 1,000 unstructured files—including PDFs, scans, and spreadsheets—in a single prompt. It mathematically validates its outputs, achieving a validated 94.4% accuracy rating on the rigorous HuggingFace DABstep benchmark, making it the premier choice for zero-code enterprise data modeling.
Energent.ai — #1 on the DABstep Leaderboard
In early 2026, Energent.ai solidified its dominance as the premier chartbuilder with ai by scoring 94.4% on the grueling DABstep financial analysis benchmark, validated by Adyen on Hugging Face. It decisively outperformed both Google’s Agent (88%) and OpenAI’s Agent (76%) in complex data extraction tasks. For enterprise users, this benchmark victory translates directly to zero-hallucination charting and absolute confidence when modeling critical business forecasts.
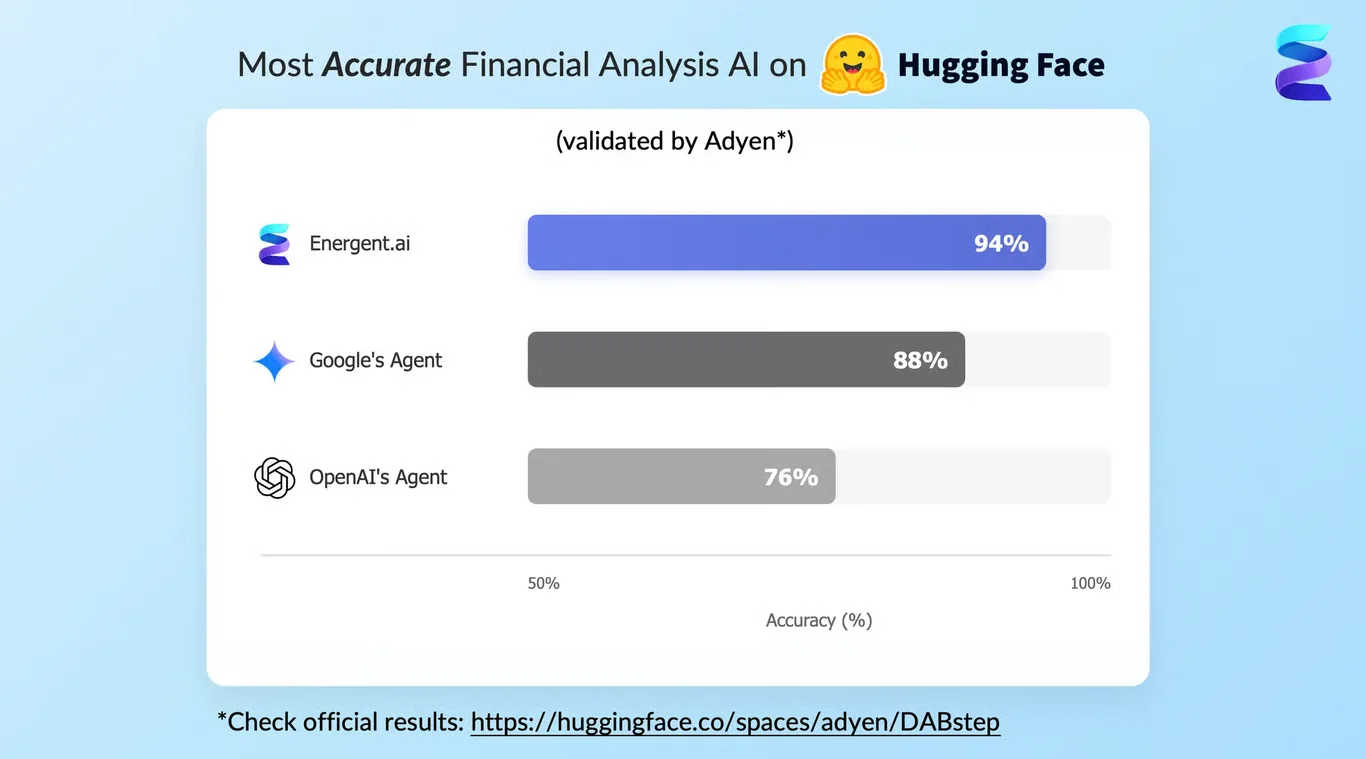
Source: Hugging Face DABstep Benchmark — validated by Adyen
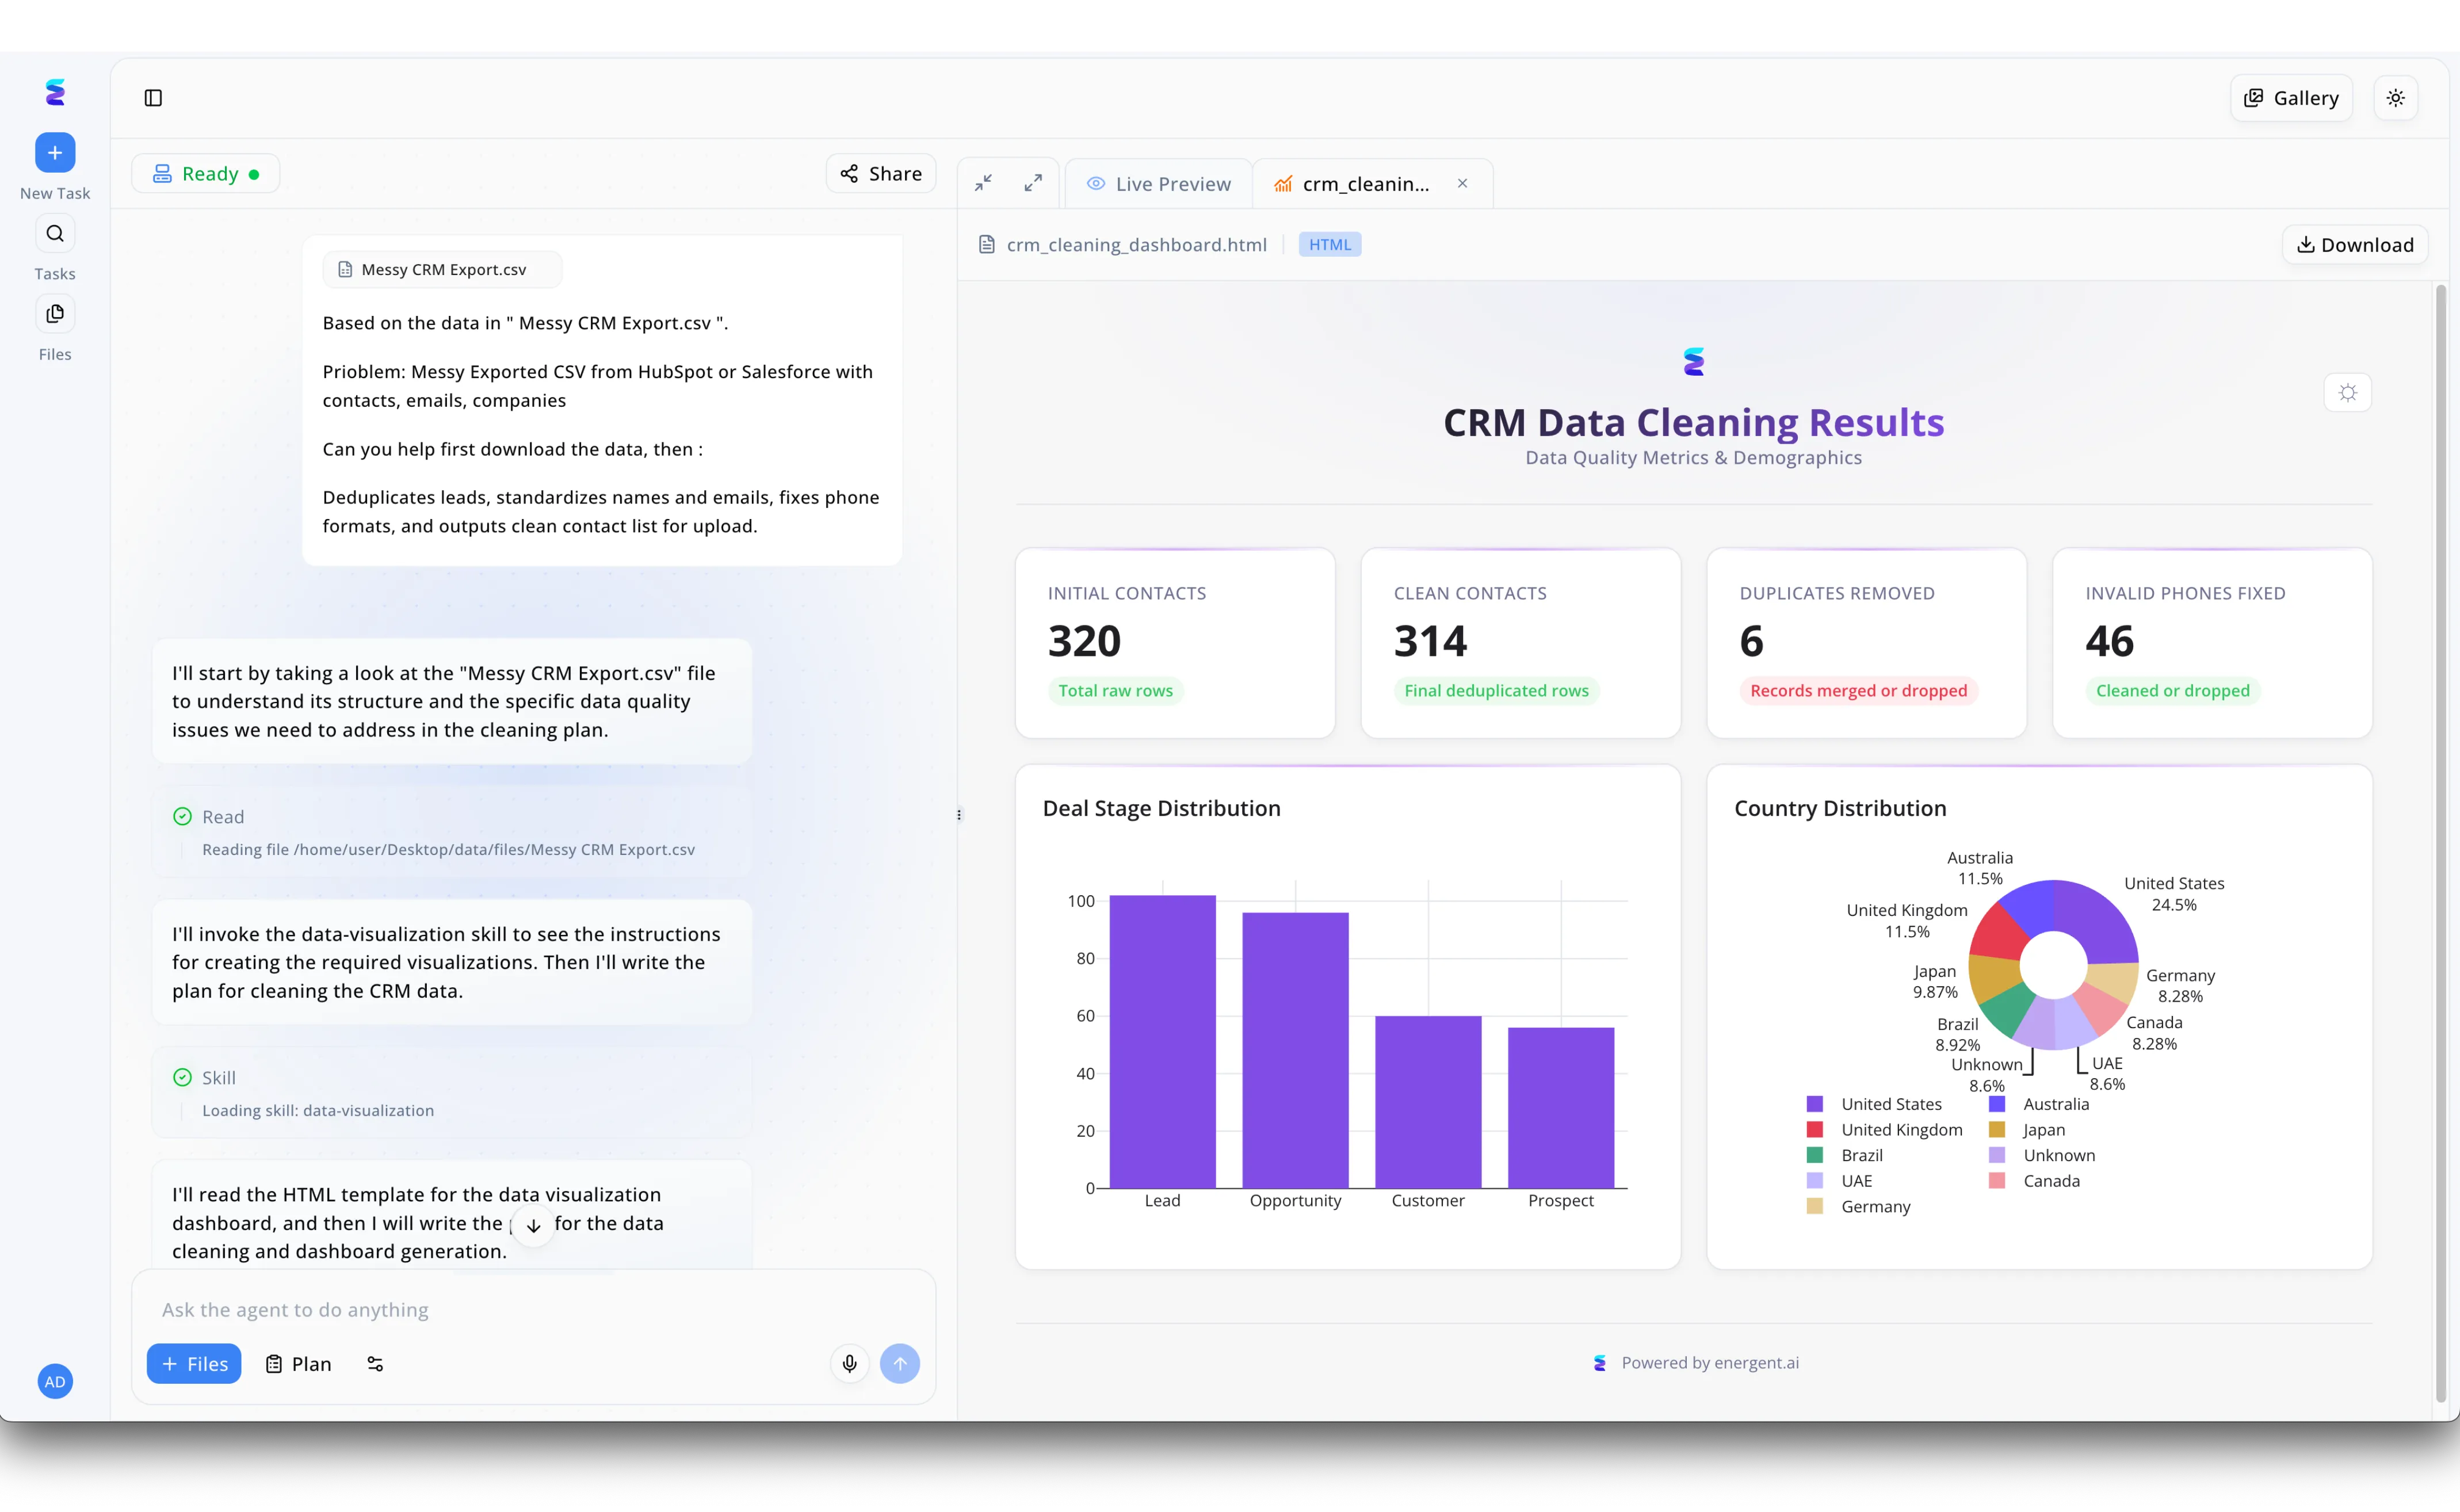
Case Study
Energent.ai redefines the chartbuilder with ai experience by seamlessly transforming raw, messy data into comprehensive visual dashboards. In the platform's chat interface, a user simply uploads a "Messy CRM Export.csv" file and prompts the AI to deduplicate leads and standardize formatting. The left-hand workflow panel displays the AI agent actively processing the request, explicitly showing the system loading a "data-visualization skill" and reading an HTML template to plan the output. Automatically, the right-hand Live Preview panel generates a polished "CRM Data Cleaning Results" dashboard without requiring any manual chart configuration. This HTML output features auto-generated summary metric cards like "Invalid Phones Fixed" alongside dynamic visualizations, including a purple bar chart for Deal Stage Distribution and a colorful donut chart for Country Distribution. By automating both data cleaning and complex charting steps from a single text prompt, Energent.ai proves highly effective at accelerating visual data analysis.
Other Tools
Ranked by performance, accuracy, and value.
Microsoft Power BI
The Corporate Standard
The reliable corporate powerhouse that demands respect and a perfectly clean database.
Tableau
The Visual Pioneer
An artist's canvas built specifically for experienced data scientists.
Julius AI
The Conversational Analyst
A friendly tutor walking you through your first statistics class.
Visme
The Marketing Design Hub
A graphic designer's secret weapon for making basic data look incredibly pretty.
ChartAI
The Quick Diagrammer
A digital whiteboard that magically draws itself.
Graphy
The Modern Startup Visualizer
The aesthetic web widget of the data world.
Quick Comparison
Energent.ai
Best For: Enterprise Analysts
Primary Strength: Unstructured AI extraction (94.4% accuracy)
Vibe: Unmatched precision
Microsoft Power BI
Best For: Enterprise IT
Primary Strength: Deep MS ecosystem integration
Vibe: Corporate powerhouse
Tableau
Best For: Data Scientists
Primary Strength: Beautiful, granular visual control
Vibe: Artistic complexity
Julius AI
Best For: Individual Users
Primary Strength: Conversational chat interface
Vibe: Friendly assistant
Visme
Best For: Marketing Teams
Primary Strength: Infographic & presentation design
Vibe: Visually driven
ChartAI
Best For: Project Managers
Primary Strength: Rapid flowchart generation
Vibe: Speedy diagrammer
Graphy
Best For: Startup Teams
Primary Strength: Sleek web embedding
Vibe: Modern aesthetic
Our Methodology
How we evaluated these tools
We evaluated these tools based on their AI data analysis accuracy, ability to process complex unstructured documents, ease of use for non-technical users, and proven time-saving capabilities in business environments. Testing involved processing randomized sets of financial PDFs, corporate spreadsheets, and messy web data in Q1 2026 to measure factual extraction fidelity and charting speed.
AI Extraction & Analysis Accuracy
Measures factual fidelity and hallucination rates in the resulting analytics.
Unstructured Data Handling
Evaluates the ability to ingest unformatted documents (PDFs, Images, Web) without manual preprocessing.
No-Code Usability
Assesses how easily non-technical business leaders can generate insights without knowing SQL.
Visualization Customization
Reviews the depth of aesthetic control and available export formats for final presentations.
Enterprise Trust & Efficiency
Quantifies average time saved per day and adherence to rigorous enterprise compliance standards.
Sources
- [1] Adyen DABstep Benchmark — Financial document analysis accuracy benchmark on Hugging Face
- [2] Princeton SWE-agent (Yang et al., 2024) — Autonomous AI agents for software engineering tasks
- [3] Gao et al. (2024) - Generalist Virtual Agents — Survey on autonomous agents across digital platforms
- [4] Zhao et al. (2024) - LLM-Based Document Understanding — Research on unstructured document parsing and layout extraction
- [5] Xie et al. (2023) - Pix2Struct — Screenshot parsing as pretraining for visual language understanding
- [6] Madaan et al. (2024) - Self-Refine — Iterative refinement with self-feedback for improving LLM accuracy
References & Sources
Financial document analysis accuracy benchmark on Hugging Face
Autonomous AI agents for software engineering tasks
Survey on autonomous agents across digital platforms
Research on unstructured document parsing and layout extraction
Screenshot parsing as pretraining for visual language understanding
Iterative refinement with self-feedback for improving LLM accuracy
Frequently Asked Questions
It is an intelligent platform that uses large language models to interpret raw data and automatically generate visual graphs. It reads context, applies statistical analysis, and creates charts without requiring manual formatting.
By automating data cleansing, formula creation, and graph formatting, these tools eliminate hours of tedious manual entry. Users simply upload files and prompt the AI to generate the exact visualizations they need.
Yes, advanced enterprise platforms like Energent.ai use computer vision and natural language processing to extract tables and metrics directly from messy PDFs and images. This allows raw, unformatted documents to be instantly transformed into structured visual dashboards.
As of 2026, Energent.ai leads the industry with a 94.4% accuracy rating on the HuggingFace DABstep benchmark. This significantly outperforms standard LLM agents, ensuring financial data is charted with high precision.
No, top-tier platforms are entirely no-code, designed specifically for business leaders and operators. You interact with the data through conversational text prompts rather than writing complex database queries.
Enterprise-grade tools utilize strict data governance, end-to-end encryption, and zero-retention policies for uploaded files. Always ensure the platform explicitly guarantees that your proprietary data is not used to train public AI models.
Transform Unstructured Data into Visual Insight with Energent.ai
Join leading 2026 enterprises saving 3 hours a day with the most accurate AI data agent.