Crestline Strategy Group asesora a equipos directivos en presentaciones formales al consejo de planes financieros plurianuales. Rachel Owens lidera los compromisos a nivel CFO de la firma, donde cada supuesto de un pronóstico de 3 años debe resistir un cuestionamiento adversarial por parte de directores con experiencia en inversión y operaciones. Los consejos tratan un pronóstico de la dirección como una hipótesis hasta que los responsables de los supuestos pueden señalar una señal específica y verificable.
Cinco series FRED, diez vectores de ataque, una fecha de consejo
El encargo tenía un requisito ineludible: producir diez respuestas modelo a las preguntas del consejo con mayor probabilidad de exponer los supuestos macroeconómicos del plan a tres años. Cada pregunta apuntaba a una vulnerabilidad concreta: una perspectiva de crecimiento comprimida, un exceso de inflación, un shock en el costo de capital impulsado por tasas, un escenario de endurecimiento del mercado laboral. Cada respuesta tenía que citar una señal observada, no proyectada.
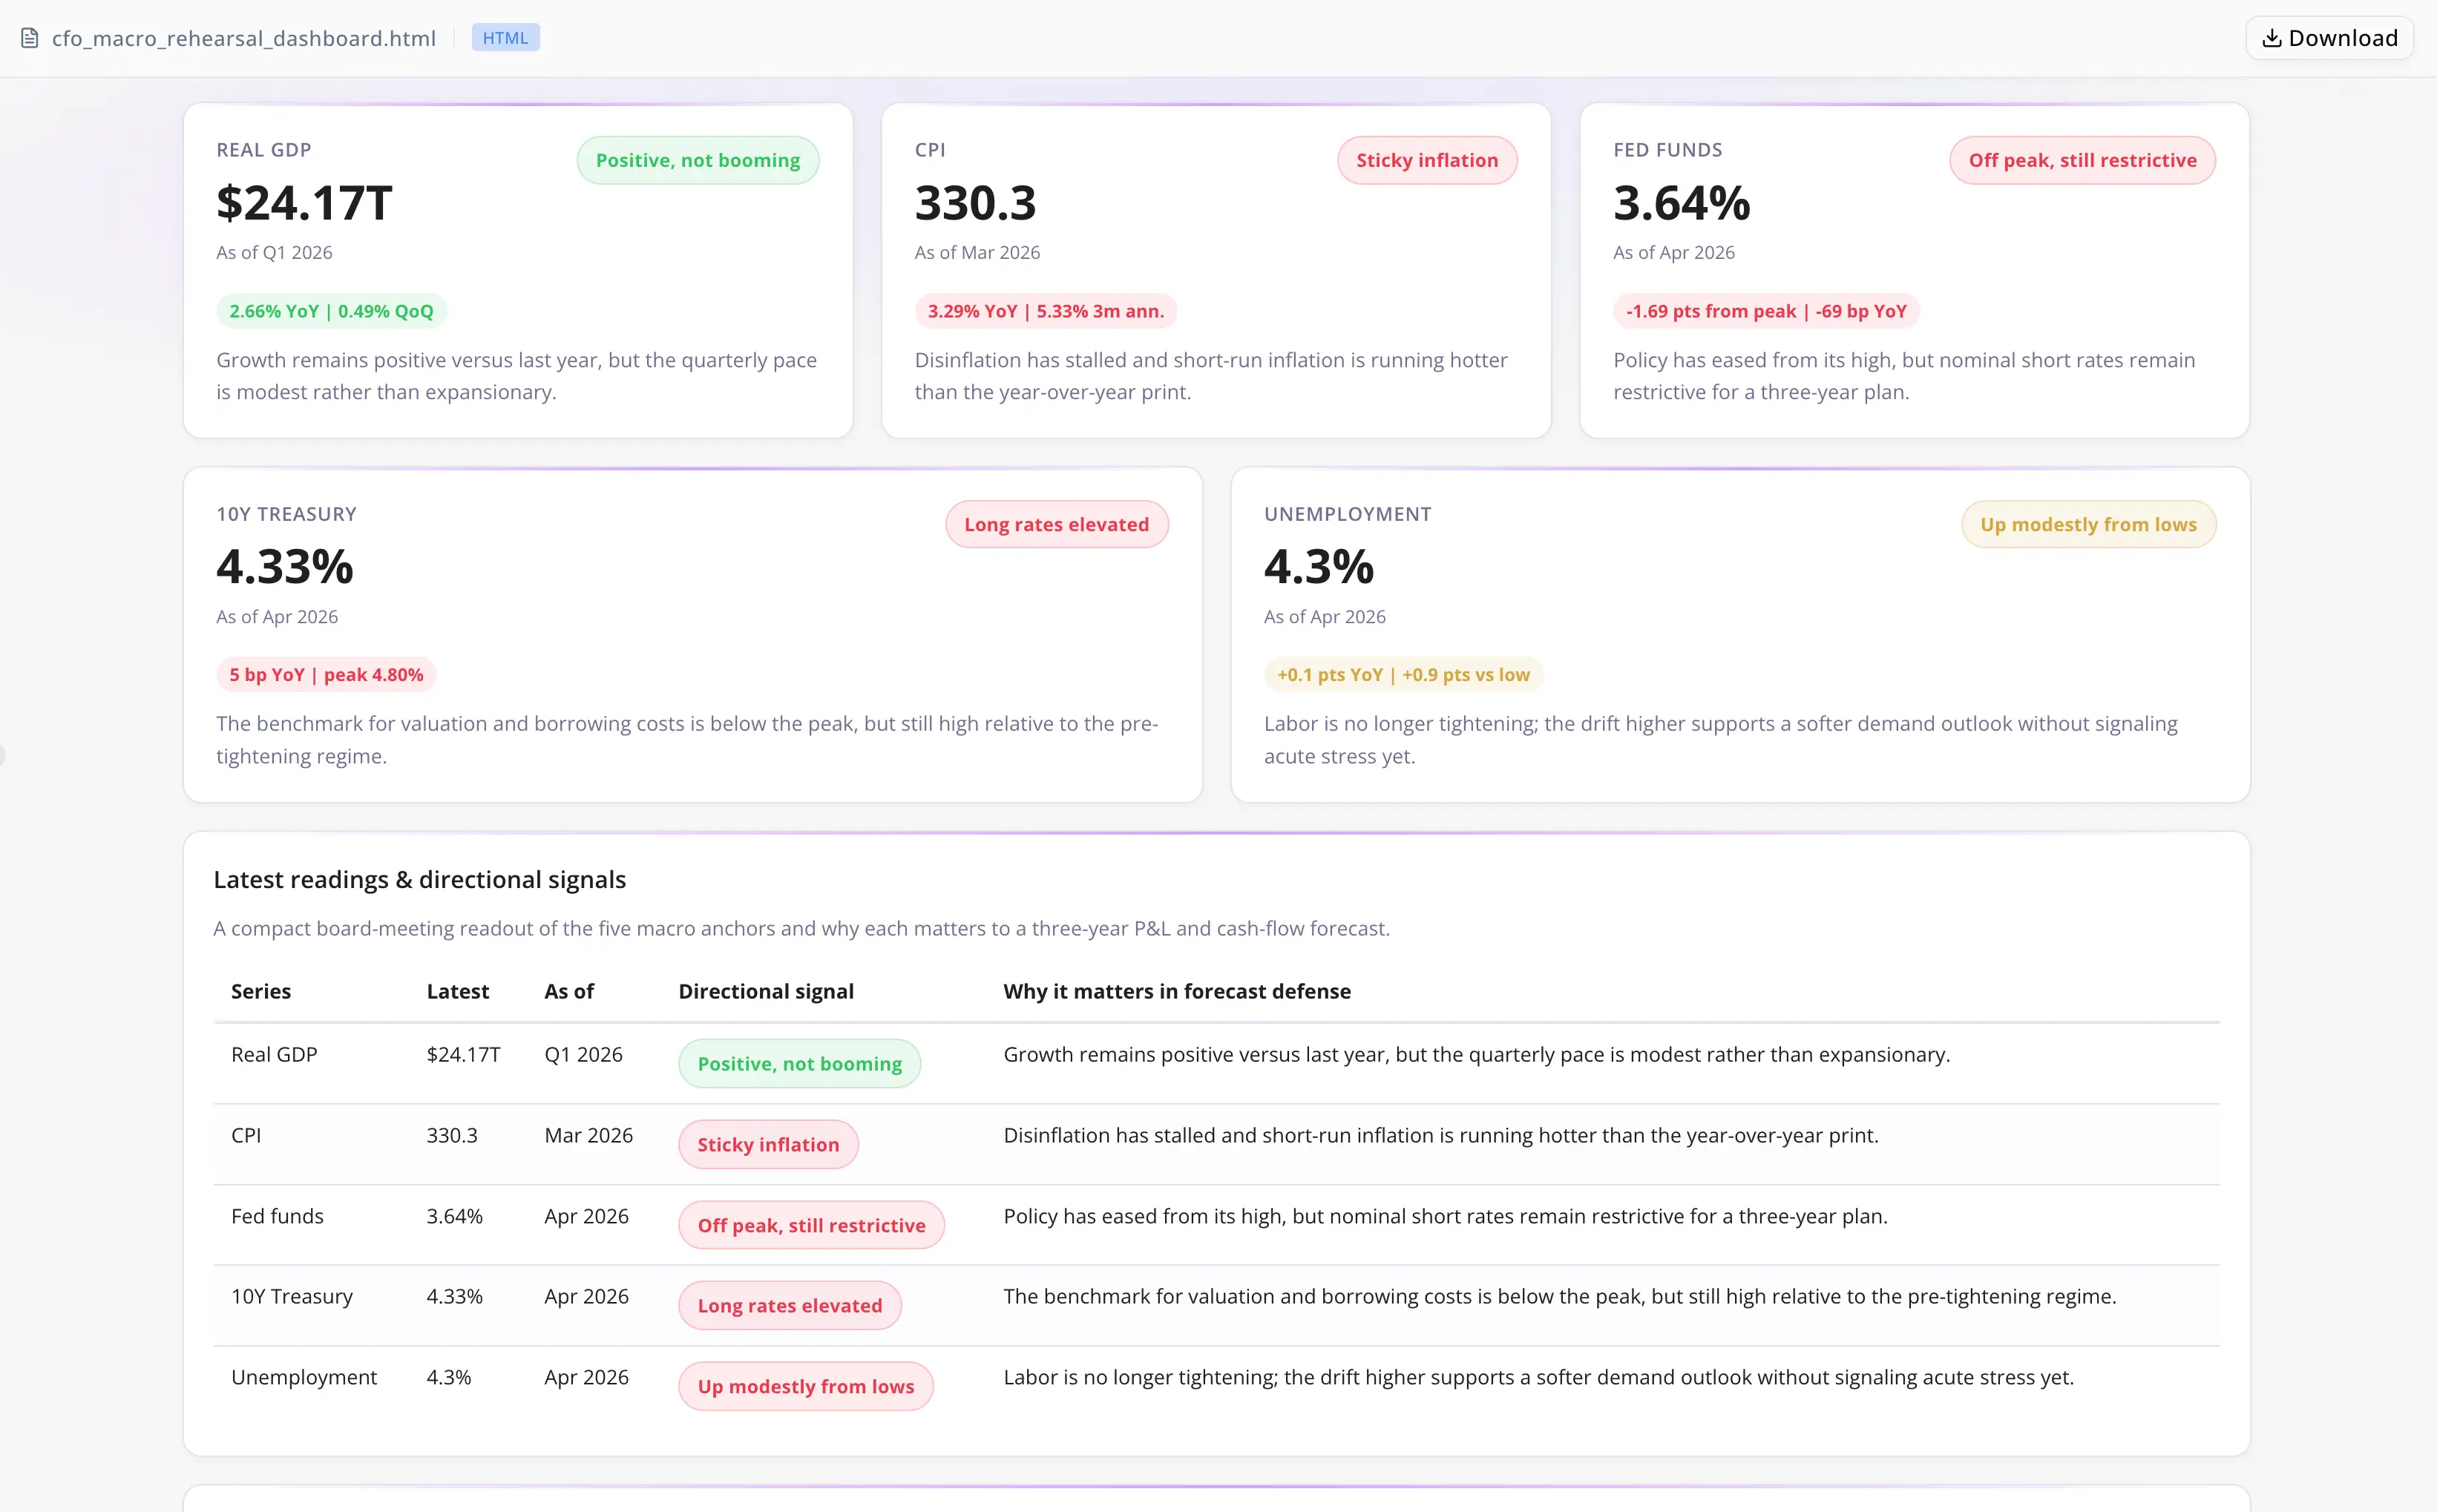
Los datos subyacentes abarcaban cinco series de Federal Reserve Economic Data (FRED): crecimiento real del PIB (trimestral), inflación del CPI (mensual), la tasa de fondos federales, el rendimiento del Treasury a 10 años y la tasa de desempleo. Cada serie tiene una frecuencia de publicación distinta y una relevancia distinta para los supuestos bajo ataque. Armonizar cinco series con granularidades diferentes, calcular señales direccionales y traducirlas a un lenguaje defendible para el consejo es una tarea analítica completa antes de que empiece cualquier redacción.
Un segundo entregable surgió después de completar el borrador inicial de la sesión informativa: un dashboard de visualización interactivo que cubriera las cinco dimensiones macroeconómicas. La brecha solo apareció mediante una verificación independiente — precisamente el tipo de requisito de última hora que obliga a una segunda pasada analítica completa en un flujo de trabajo estándar.
Energent.ai ejecutó toda la preparación en una sola sesión
El agente gestionó el alcance completo sin traspasos entre herramientas:
- Cargó e inspeccionó los cinco archivos CSV de FRED, confirmando la cobertura de fechas y la observación más reciente de cada serie
- Armonizó las frecuencias entre series trimestrales, mensuales y diarias en un marco analítico común
- Calculó señales direccionales para crecimiento, inflación, tasa corta, tasa larga y condiciones laborales — cada métrica trazable a los archivos fuente adjuntos, ninguna derivada de conocimiento general
- Redactó la sesión informativa de ensayo: diez preguntas del consejo, diez respuestas modelo, diez compromisos de seguimiento, escritos en registro de presentación al consejo
- Ejecutó una pasada de verificación independiente, confirmando que cada afirmación cuantitativa coincidía con los datos fuente — y detectando el dashboard faltante antes de la finalización
- Construyó un dashboard macro interactivo en HTML que cubría las cinco dimensiones, con los puntos de presión del pronóstico anotados
Sin armonización manual de frecuencias. Sin una herramienta BI aparte para el dashboard. Sin una segunda pasada analítica para cerrar la brecha de verificación.

Señales vinculadas a los datos fuente, no a la memoria del analista
- Cada cita es trazable. Ninguna señal del paquete de ensayo provino de conocimiento general ni de un ciclo de briefing anterior: cada una se calculó directamente a partir de los archivos FRED adjuntos.
- La verificación se ejecutó antes de que el consejo viera nada. La comprobación independiente confirmó la coherencia interna entre las afirmaciones del briefing y los datos fuente, y detectó la visualización faltante antes de que el paquete de entregables saliera del equipo.
- Compromisos de seguimiento, no solo respuestas. Cada una de las diez respuestas del consejo incluye un disparador prospectivo: la serie específica y el umbral que provocarían una revisión del plan.
- Ambos entregables en una sola pasada. El documento y el dashboard se finalizaron juntos, eliminando la sobrecarga de coordinación de dividir el trabajo entre herramientas o miembros del equipo.
De tres a cuatro días de trabajo analítico reducidos a una sola sesión
- Dos entregables verificados y listos para el consejo: una sesión informativa de ensayo de diez preguntas y un dashboard macro interactivo
- Diez respuestas modelo, cada una vinculada a una serie FRED identificada y a una señal específica calculada a partir de los archivos fuente adjuntos
- La verificación independiente detectó la visualización faltante antes de la sesión del consejo, evitando un paquete de entregables incompleto
- Alcance total — ingesta de datos, armonización de frecuencias, cálculo de señales, redacción del documento, verificación, corrección de brechas y construcción del dashboard — completado en una sola sesión frente a tres a cuatro días de analista en tres a cuatro herramientas separadas

"La parte que de forma constante consume más tiempo de preparación no es redactar las respuestas — es asegurarse de que cada respuesta pueda defenderse con una cifra específica que otra persona pueda verificar contra una fuente identificada." — Rachel Owens, CFO at Crestline Strategy Group